Extreme Winds and Atmospheric Gravity Waves
Why did the Marshall Fire spread so rapidly?
On December 30, 2021, the Marshall Fire caused unprecedented destruction in Boulder County, Colorado, becoming one of the most devastating wildfires in the state’s history.
More than 1,000 homes were destroyed in only a few hours.
The reasons behind this rapid and extreme fire spread are explained in detail in an official report published by NOAA (National Oceanic and Atmospheric Administration) and the National Weather Service (NWS) Boulder Office:

Based on this report and additional atmospheric analysis, the key factors can be summarized as follows:
- Wet conditions during early 2021 promoted grass growth, followed by persistent dry conditions in the latter half of the year
- Sustained extreme winds with gusts exceeding 100 mph, accompanied by the formation of atmospheric gravity waves over Boulder County
- Ignition occurring in the Marshall area, located near the southeastern edge of Boulder
The first condition was common across the Front Range, the region along the eastern foothills of the Rocky Mountains.
This implies that similar large-scale wildfire risk exists throughout the Front Range whenever the latter two conditions are met, highlighting the importance of preparedness.
Atmospheric conditions before, during, and after the fire
The initial ignition occurred shortly before noon on December 30.
To examine the atmospheric environment, east–west vertical cross-sections were analyzed for:
- December 29, 12:00 MST
- December 30, 12:00 MST (fire outbreak)
- December 31, 12:00 MST
These cross-sections were created using NOAA GFS (Global Forecast System) analysis data, which assimilates real-world observations and represents the most realistic atmospheric state.
Forecast cross-sections based on GFS are published in near real time on YRAIN.COM.
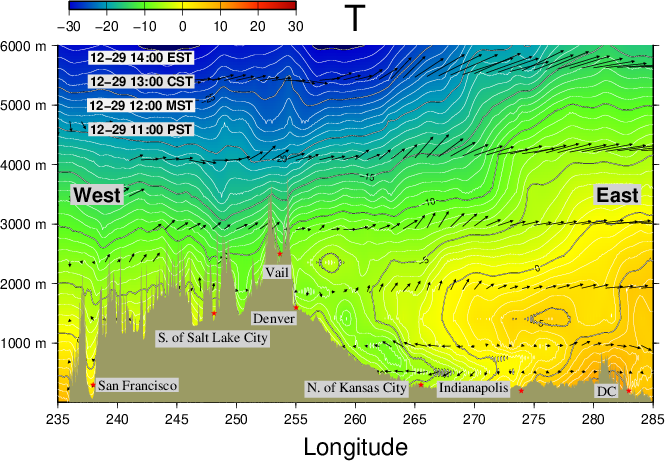
December 29, 2021 – 12:00 MST
The cross-sections along 40°N latitude up to 6,000 m altitude show relatively smooth temperature and wind structures.
These serve as a baseline for comparison with the fire-day conditions.
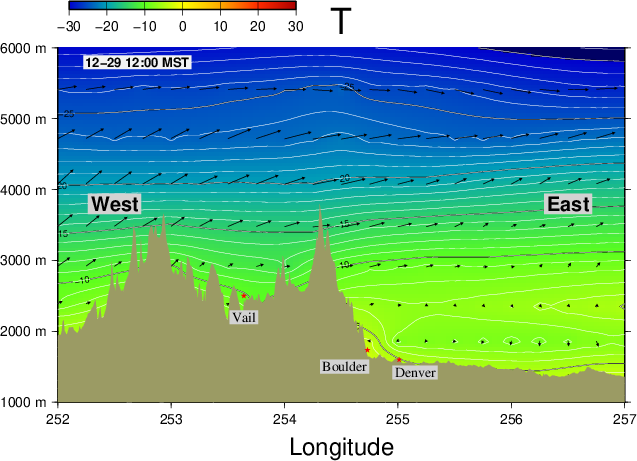
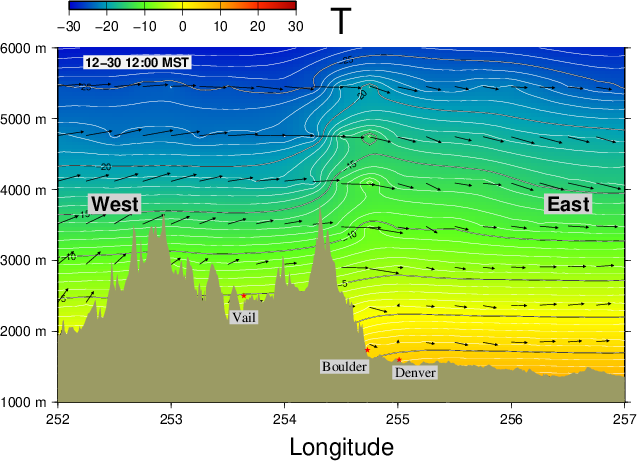
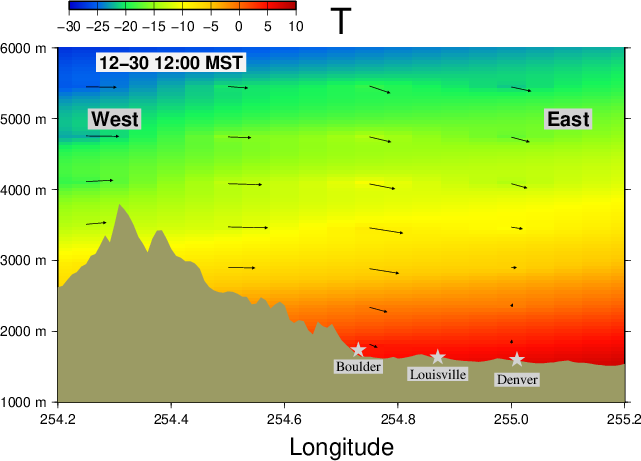
December 30, 2021 – 12:00 MST (Fire outbreak)
At the time of the fire, the atmosphere exhibited distinct wave-like temperature oscillations on the eastern side of the Rocky Mountain Continental Divide.
These patterns are consistent with atmospheric gravity waves, as described in the NOAA Marshall Fire report.
Atmospheric gravity waves are oscillations generated when strong winds interact with mountainous terrain, often leading to persistent downslope winds and localized wind acceleration near the surface.
Such conditions can dramatically intensify wildfire behavior.
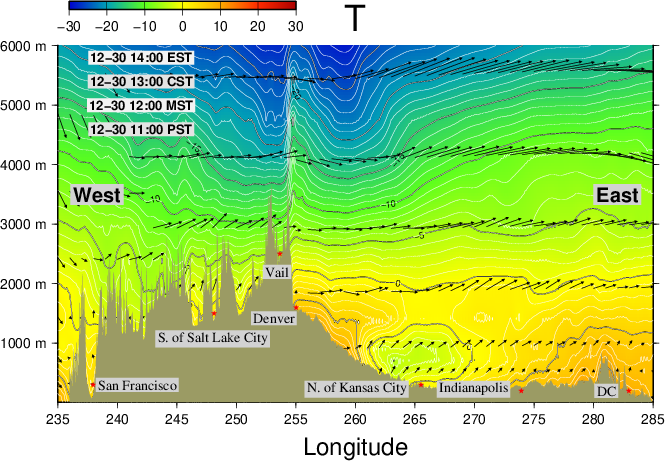
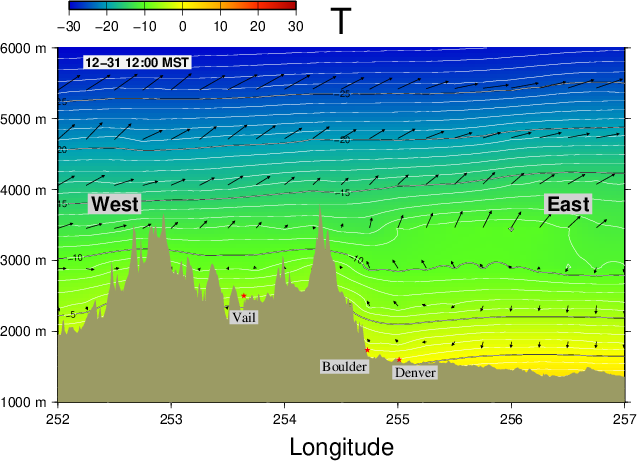
December 31, 2021 – 12:00 MST
One day after the fire outbreak, the wave-like atmospheric structure had disappeared, indicating the collapse of the gravity-wave-driven wind regime.
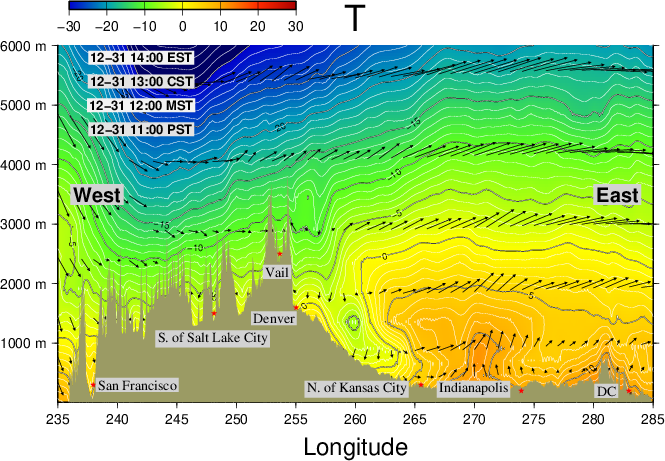
Because these cross-sections are derived from a global-scale model, they cannot fully resolve local-scale atmospheric structures on the order of a few kilometers.
A more complete understanding of the gravity-wave dynamics would require high-resolution numerical modeling (e.g., ~1 km grid spacing) using GFS analyses and forecasts as background and boundary conditions.
Such modeling is critical for improving wildfire risk assessment and future disaster mitigation.
Key factors that led to the Marshall Fire disaster
(1) Vegetation growth followed by extreme drying
According to the NOAA report, several months of unusually dry conditions preceded the fire.
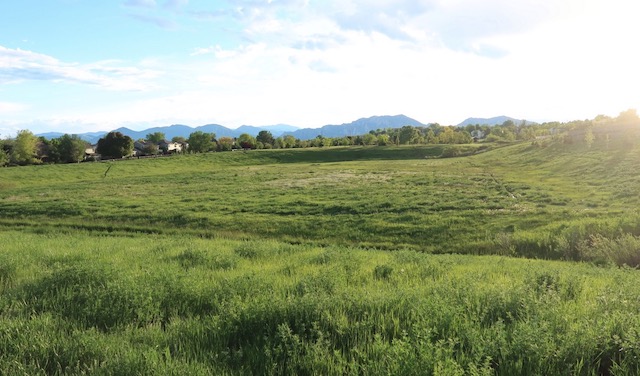
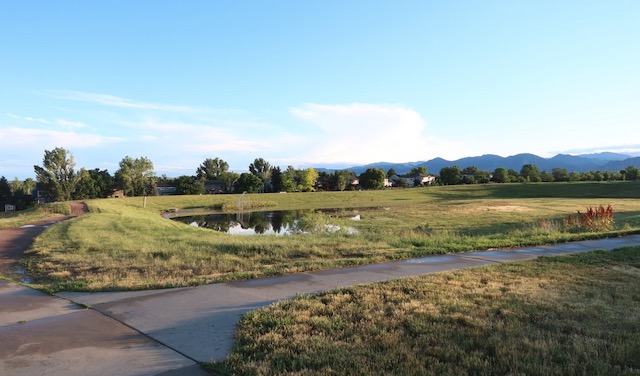
Early in 2021, wet conditions promoted widespread grass growth across the Front Range.
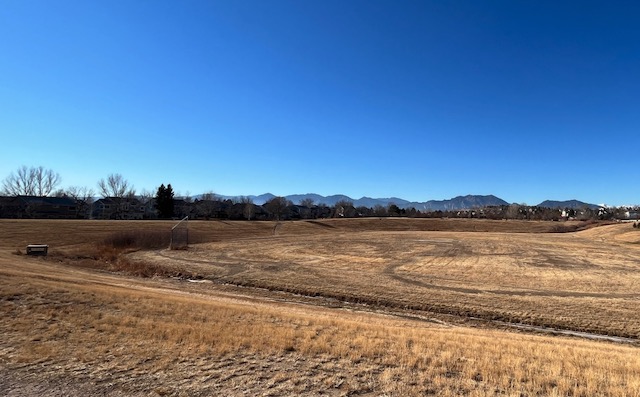
By late fall and early winter, these grasses had dried completely, leaving large amounts of fine, highly flammable fuel.
Photographs taken near Louisville, Colorado, clearly show lush conditions in early summer and completely desiccated landscapes by mid-December.
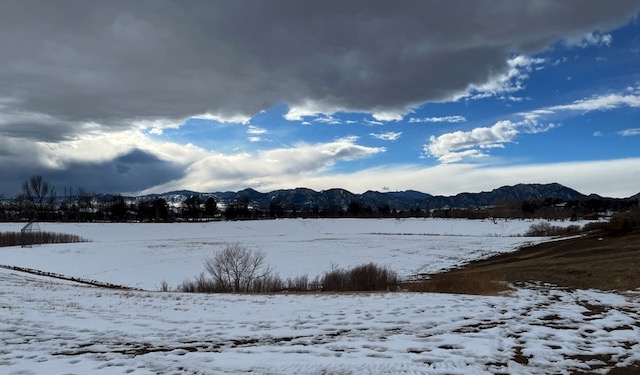
Had significant snowfall occurred before December 30, it is highly likely that the same wind event would not have resulted in such catastrophic fire spread.
(2) Extreme winds and persistent atmospheric gravity waves
Wind observations from NCAR (National Center for Atmospheric Research) at two locations in Boulder show sustained extreme winds:
- Mesa Laboratory (southern Boulder, closer to ignition area)
- Foothills Laboratory (northern Boulder)
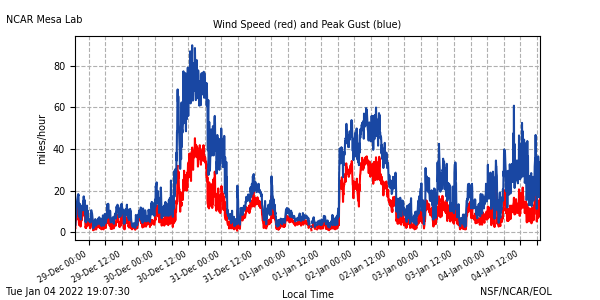
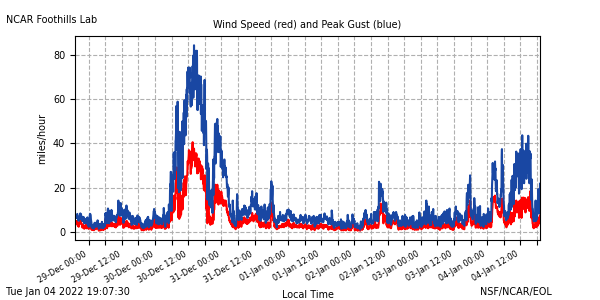
Both stations recorded gusts exceeding 80 mph for many hours, with localized gusts approaching or exceeding 100 mph.
Although another fire ignited in northern Boulder County the same day, it was contained quickly.
In contrast, the Marshall Fire spread explosively under the influence of persistent gravity-wave-enhanced downslope winds.
These conditions likely allowed embers and firebrands to be transported far downwind, resulting in multiple spot fires igniting simultaneously across residential areas.
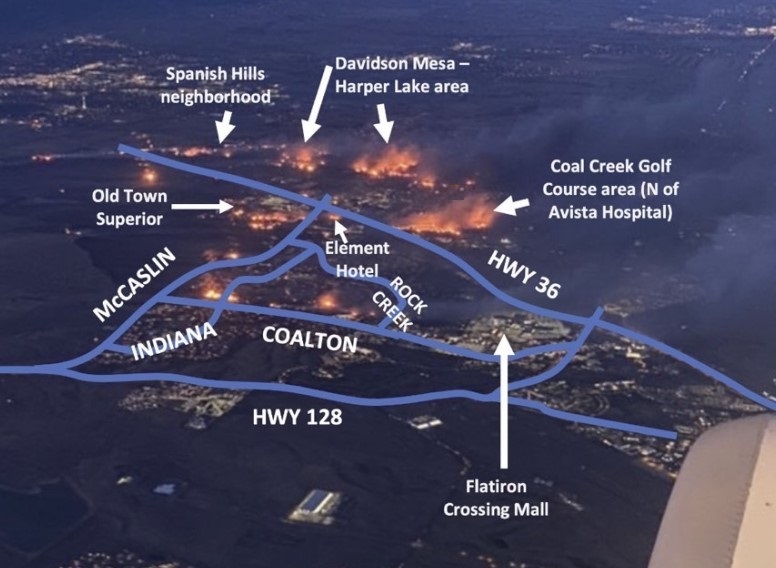
(3) Downwind residential areas
The Marshall area is located near the southeastern edge of Boulder.
On December 30, strong westerly winds dominated, placing the towns of Superior, Louisville, Lafayette, and Broomfield directly downwind.
As a result, evacuation and pre-evacuation orders were issued rapidly across these communities.
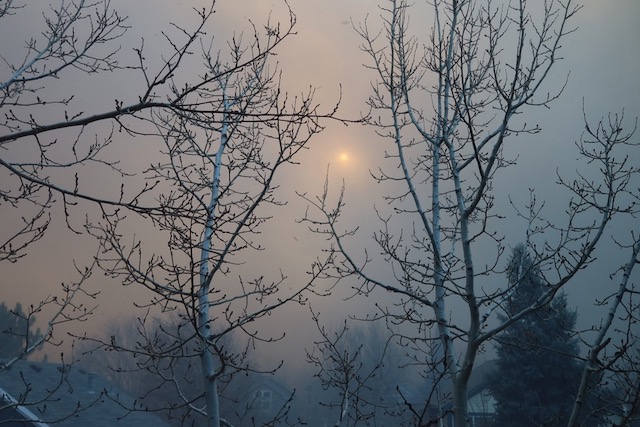
Smoke just before evacuation during the Marshall Fire (photographed from the backyard)
Conclusion
The Marshall Fire was not caused by a single factor, but by a rare and dangerous combination of:
- Prolonged dry fuel conditions
- Sustained extreme winds lasting several hours
- Atmospheric gravity waves generated by Rocky Mountain terrain
Once ignition occurred, the fire spread rapidly through ember transport and wind-driven spot fires, destroying more than 1,000 homes in a matter of hours.
Most importantly, the same atmospheric and geographic risk exists throughout the Front Range, where high mountains to the west favor downslope windstorms and gravity-wave formation.
Understanding these mechanisms is essential for improving wildfire forecasting, public safety planning, and climate-resilient community design.
Related: Power Outage Preparedness
Extreme wind events associated with downslope windstorms often cause widespread power outages.
Portable power stations and backup lighting can be critical for safety during such events.
ble power stations (Useful during power outages.)


Author / Project Credit
YRAIN Project
Weather & Environmental Data Visualization
NOAA GFS Forecast Visualization